Silver Price Analysis: XAG/USD retreats from 50-day EMA towards $20.00
- Silver price snaps four-day uptrend around one-month high, depressed around intraday low of late.
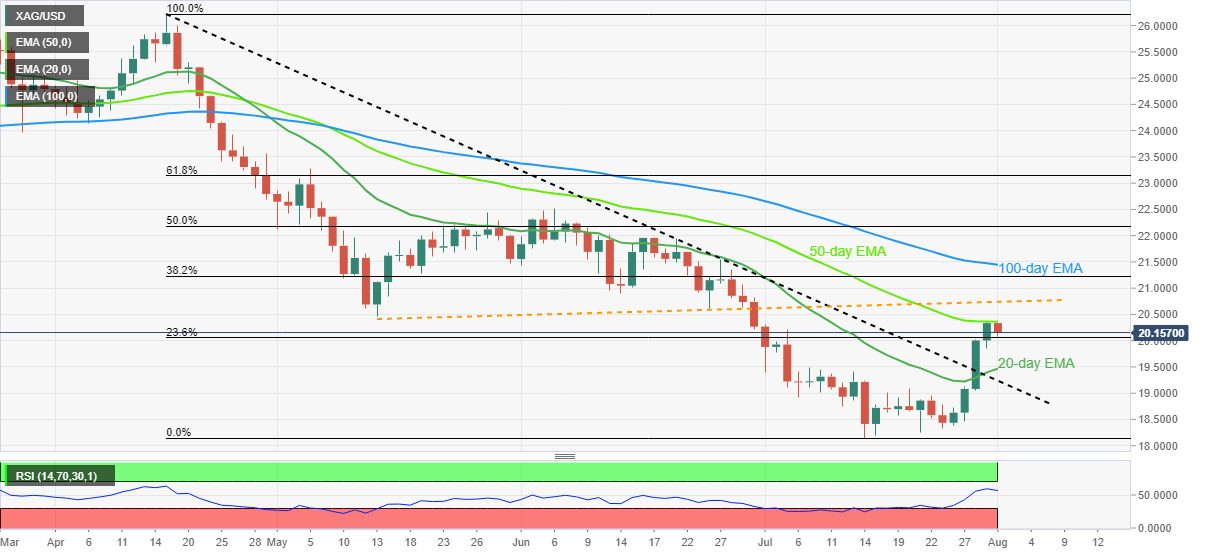
- RSI pullback, failure to cross 50-day EMA challenge buyers on the way to 100-day EMA.
- 20-day EMA, previous resistance line from April 18 restrict short-term downside.
Silver price (XAG/USD) portrays a U-turn from the 50-day EMA as the metal prints the first daily loss in five around $20.00 during early Monday morning in Europe.
In addition to the 50-day EMA, the RSI retreat also challenges the XAG/USD buyers.
However, the metal’s successful trading above the 20-day EMA and the previous resistance line from April, respectively around $19.45 and $19.20, signal further upside of the XAG/USD.
In a case where the silver price remains weak past $19.20, the $19.00 and the recent multi-month low surrounding $18.15 could challenge the bears.
Alternatively, the 50-day EMA and the support-turned-resistance line from May 13, close to $20.35 and $20.75 in that order, restrict short-term XAG/USD upside.
Also acting as an upside filter is the 100-day EMA hurdle surrounding $21.45, a break of which could direct silver buyers towards June’s monthly peak near $22.50.
To sum up, silver prices are likely to witness barricades during the further upside. Even so, the sellers are far from retaking controls.
Silver: Daily chart
Trend: Limited downside expected