Gold Price Forecast: XAU/USD faces barricades around $1,850 ahead of stable US Inflation forecasts
- Gold price is struggling at around $1,850.00 as stale US CPI forecasts support the DXY bulls.
- A slippage in the US CPI may not support the gold bulls while a higher CPI rate will strengthen the gold bears.
- The precious metal is still inside the woods and is expected to perform lackluster until the US inflation releases.
Gold price (XAU/USD) has witnessed a minor pullback after hitting a high near the critical hurdle of $1,850.00 on Thursday. The precious metal found significant offers amid improvement in the US dollar index (DXY)’s appeal and made a low of $1,840.10. However, a responsive buying action pushed the gold prices higher and at the press time, it is oscillating below $1,850.00.
Advancing uncertainty ahead of the US Inflation is responsible for wild moves in the FX domain. Doubtful breakouts and breakdowns have spooked the market participants. Market consensus is indicating a stable inflation rate at 8.3%, which states that two rate hikes announcements by the Federal Reserve (Fed) in March and May by 25 basis points (bps) and 50 bps have failed to perform their job seriously. A slippage in the core Consumer Price Index (CPI) is expected. The core CPI that excludes food and energy prices may shift lower to 5.9% vs. the prior print of 6.2%.
The price pressures are so high in the US economy that slippage in the US inflation may not support the gold’s appeal, however, a higher print will definitely trim the demand.
Gold technical analysis
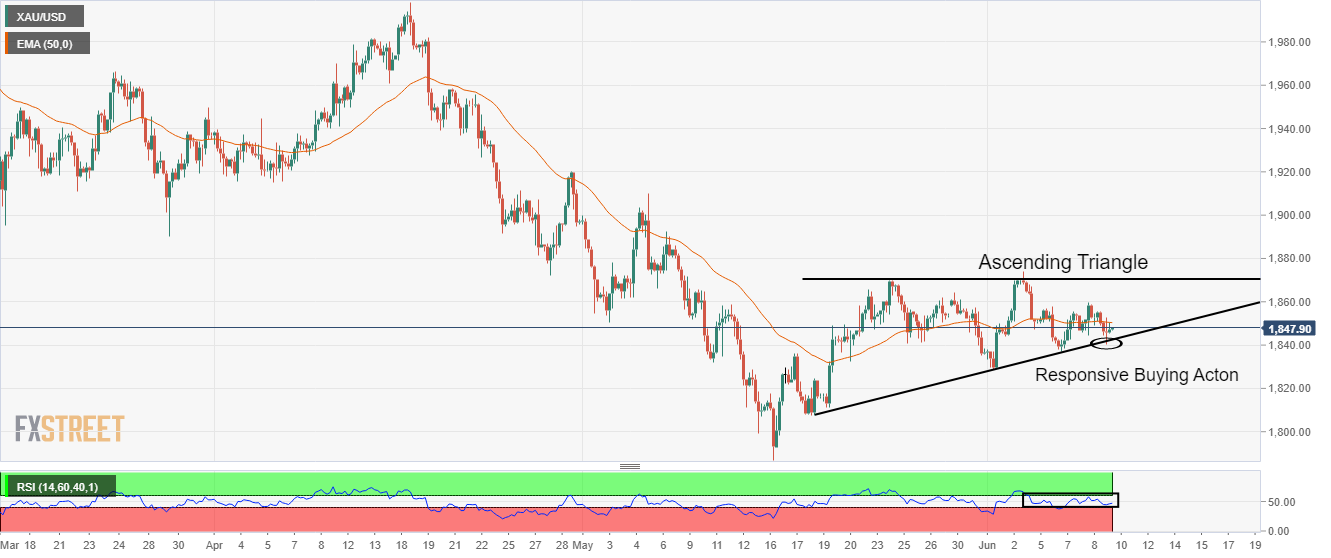
On a four-hour scale, the gold price has bounced sharply after sensing a responsive buying action from the upward sloping trendline of the Ascending Triangle which is placed from the May 16 low at $1,786.94. While the horizontal resistance is plotted from May 24 high at $1,869.69. The 50-period Exponential Moving Average (EMA) at $1,850.66 is overlapping with the gold prices, which signals a consolidation ahead. Meanwhile, the Relative Strength Index (RSI) (14) is oscillating in the 40.00-60.00 range and dictates that the precious metal needs a trigger for a decisive move.
Gold four-hour chart