USD/CAD Price Analysis: Eases below five-month-old resistance under 1.2500
- USD/CAD steps back from two-month top, fades Friday’s trend line breakout below another hurdle.
- Key trend line break, bullish MACD favor buyers.
- 50% Fibonacci retracement, 200-DMA adds to the upside filters.
USD/CAD consolidates Friday’s heavy gains with a recent decline to 1.2450 amid the initial Asian session on Monday. Even so, the Loonie pair keeps the previous day’s breakout of the key resistance line, now the immediate support, from October 2020.
Given the bullish MACD and the pair’s sustained trading above the previously important resistance, USD/CAD traders may ignore the latest weakness in the prices until the quote stays above the stated trend line around 1.2390.
It’s worth noting that 1.2320 and 1.2270 are extra filters to the pair’s downside below the previous resistance line.
Meanwhile, the fresh upside will aim for a downward sloping trend line from January 28, near 1.2485. However, any further rise needs to cross the 38.2% Fibonacci retracement of September 2020 to June 2021 downside, around 1.2550.
Though, a convergence of 200-day SMA (DMA) and 50% Fibonacci retracement level, close to 1.2705-10, will be a tough nut to crack for the bulls afterward.
Overall, USD/CAD bulls seem tiring of late but the bears need confirmation for fresh entry.
USD/CAD daily chart
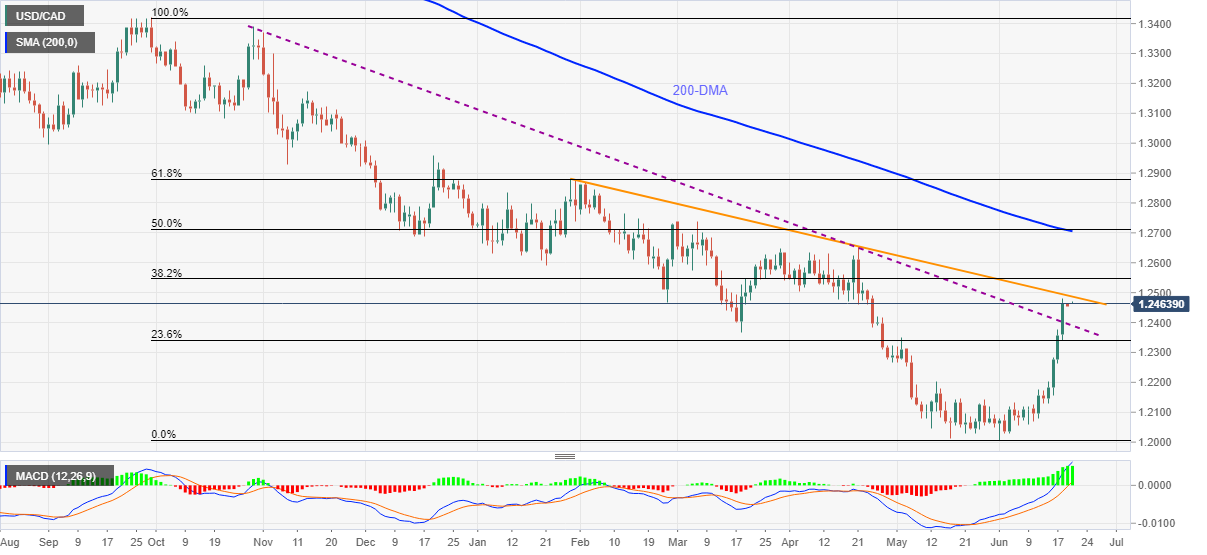
Trend: Bullish