Gold Price Analysis: XAU/USD correction on the cards towards $1,830
- Gold had been making headway to the downside ahead of the NFP event.
- Bulls are stepping in below the prior week's low in $1,802, a break of which opens $1,830 target.
Gold is under pressure as the US dollar catches a bid in a risk-on environment ahead of this week's Nonfarm Payrolls even on Friday.
However, there is scope for an upside correction and the following illustrates where the next trading opportunity could arise leading into the event.
Gold Monthly chart
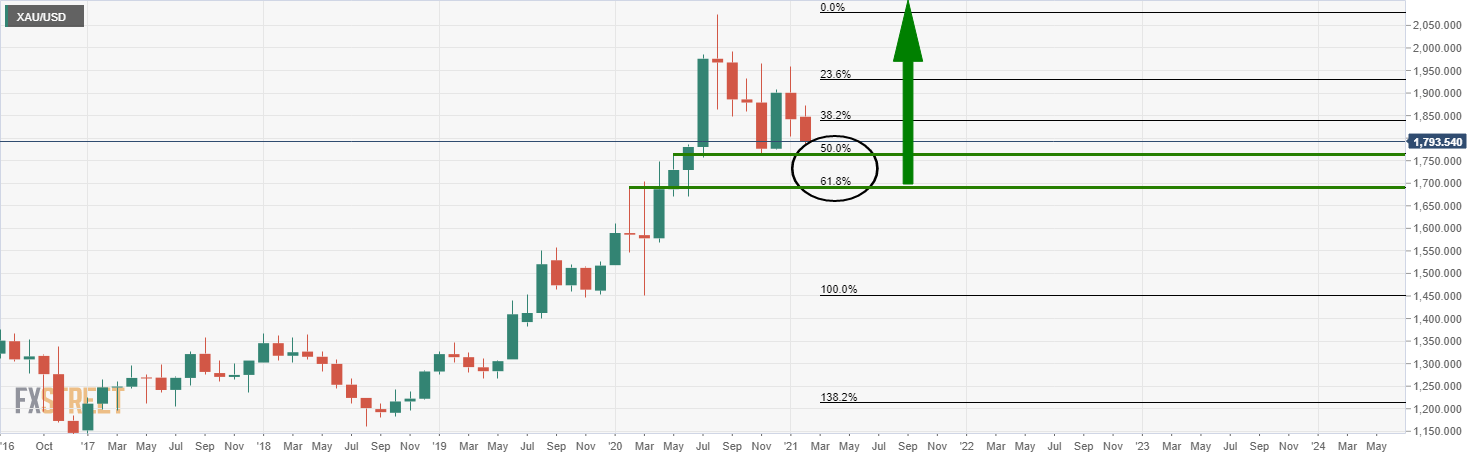
Gold is on the way to test the bull's commitments at monthly support.
Gold Weekly chart
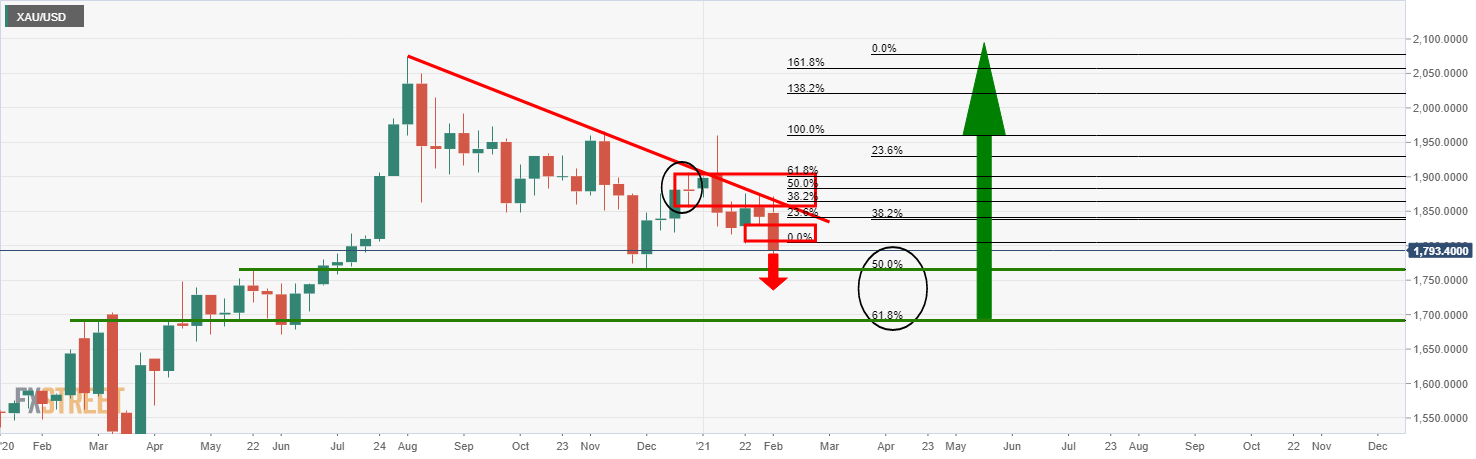
The price has made a lower low on the weekly chart, (1,802 prior low), which is encouraging for the bears so close to the close this week.
However, there is scope for a retracement which will likely be determined in Friday's US Nonfarm Payrolls event and flows in the US dollar.
Gold DXY daily chart
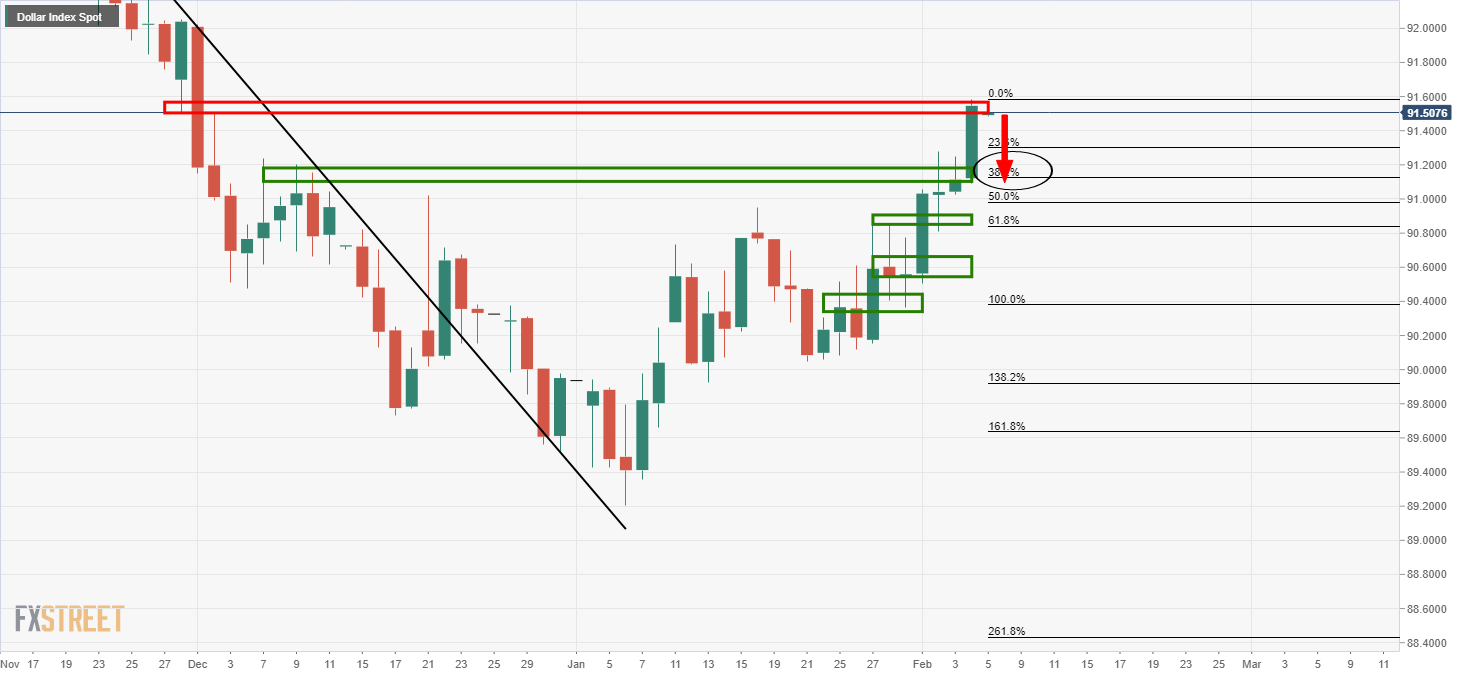
If there is a miss in expectations in the NFP's report, the dollar could come under pressure at the resistance and a 38.2% Fibonacci retracement has a confluence with prior structure.
Consequently, the price of gold would be expected to rise.
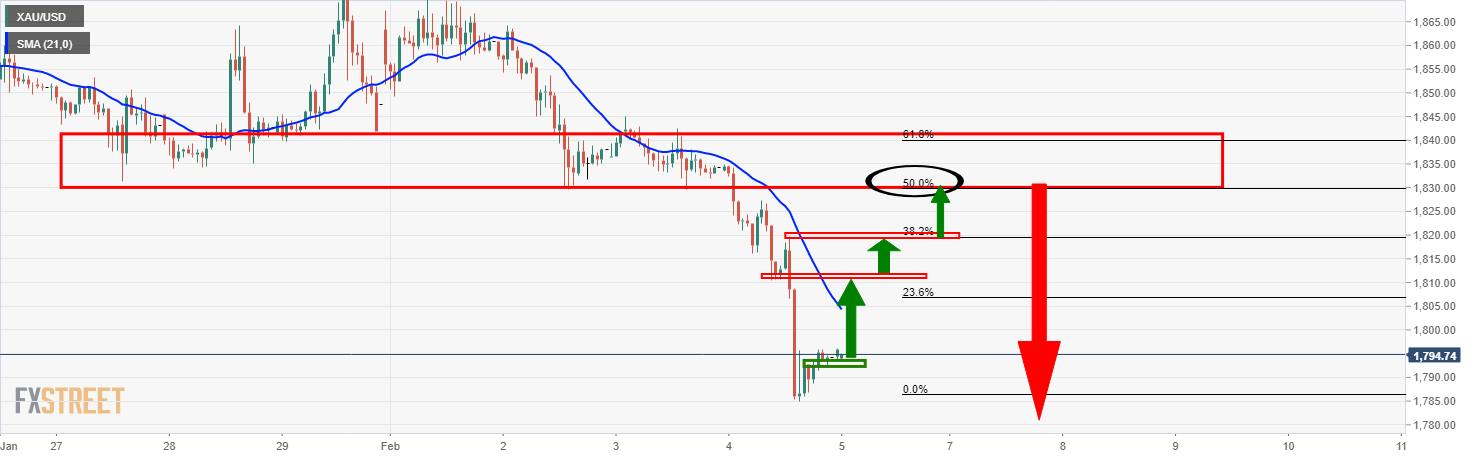
Gold Daily chart
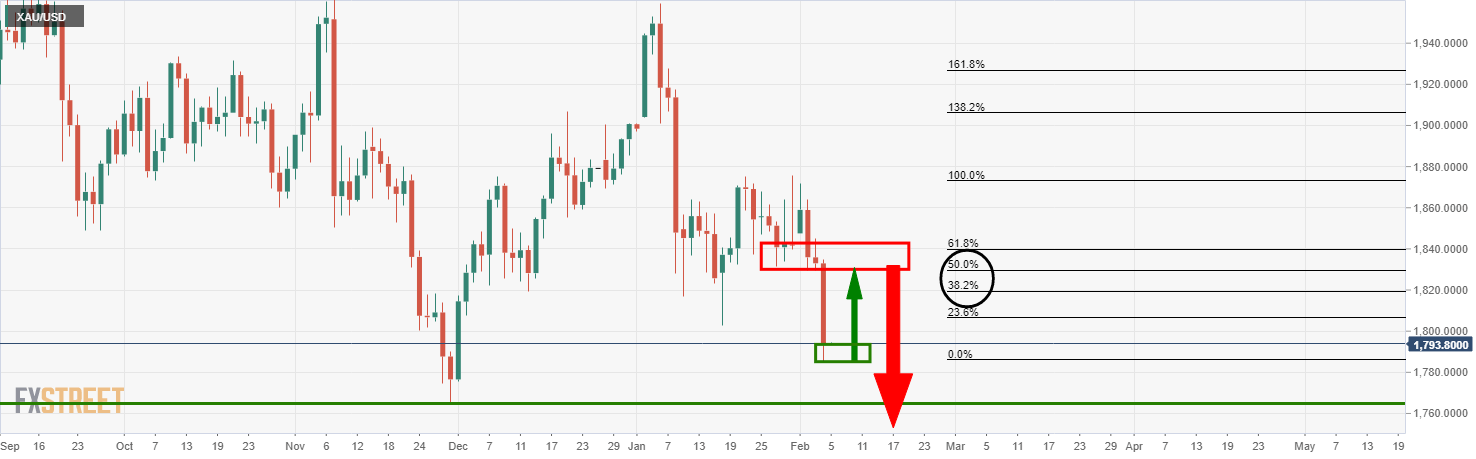
On a break above last week's low, bulls can then target either a 38.2% Fibonacci retracement or a deeper 50% mean reversion which aligns with the prior lows.
Gold 1-hour
The price remains bearish on the lower time frame in the 1-hour chart, but bulls can monitor the environment for a switch-up as the price continues to correct higher through $1,802.
An optimal entry, ideally within bullish conditions when the price breaks above the 21-hour moving average, for instance, would be achieved from a bullish structure, protected with a stop loss below it and targeting the confluence target of $1,830.