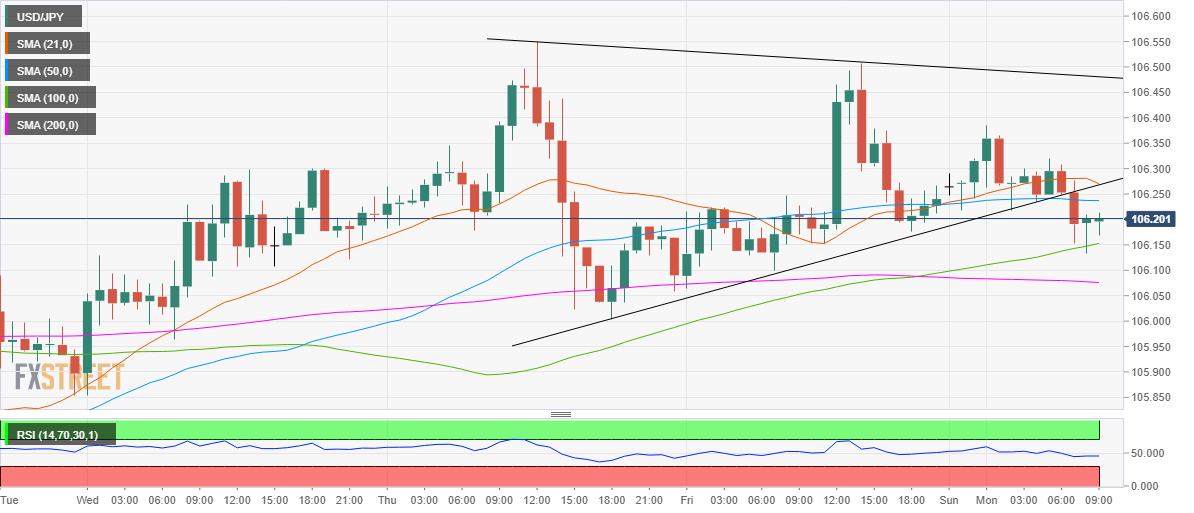
USD/JPY Price Analysis: 100-HMA support tested after symmetrical triangle breakdown
- USD/JPY looks vulnerable below 100-HMA at 106.15.
- Symmetrical triangle breakdown confirmed on the hourly chart.
- Bearish RSI calls for additional downside in the near-term.
USD/JPY finally broke its Asian consolidative mode to the downside, as the sellers took over control despite the risk-on action in the European equities and a broadly higher US dollar.
The renewed weakness in the spot can be mainly attributed to chart-based selling, especially after the price confirmed a symmetrical triangle breakdown on the hourly sticks.
At the moment, the pair is trying hard to hold onto the powerful 100-hourly Simple Moving Average (HMA) support at 106.15. The hourly Relative Strength Index (RSI) trades flat below the midline, suggesting more scope to the downside.
The horizontal 200-HMA support at 106.07 will be a tough nut to crack for the bears.
On the flip side, the 50-HMA at 106.23 could likely cap the immediate pullback. Acceptance above the latter could bring the robust support now turned resistance at 106.27 back in play. That level is the confluence of the bearish 21-HMA and the pattern support.
USD/JPY: Hourly chart

USD/JPY: Additional levels
