Back
27 Apr 2020
Silver Price Analysis: XAG/USD holds steady above $15.00/oz, bullish
- XAG/USD recovery from the 2020 lows stays intact.
- The level to beat for bulls is the 15.43 level.
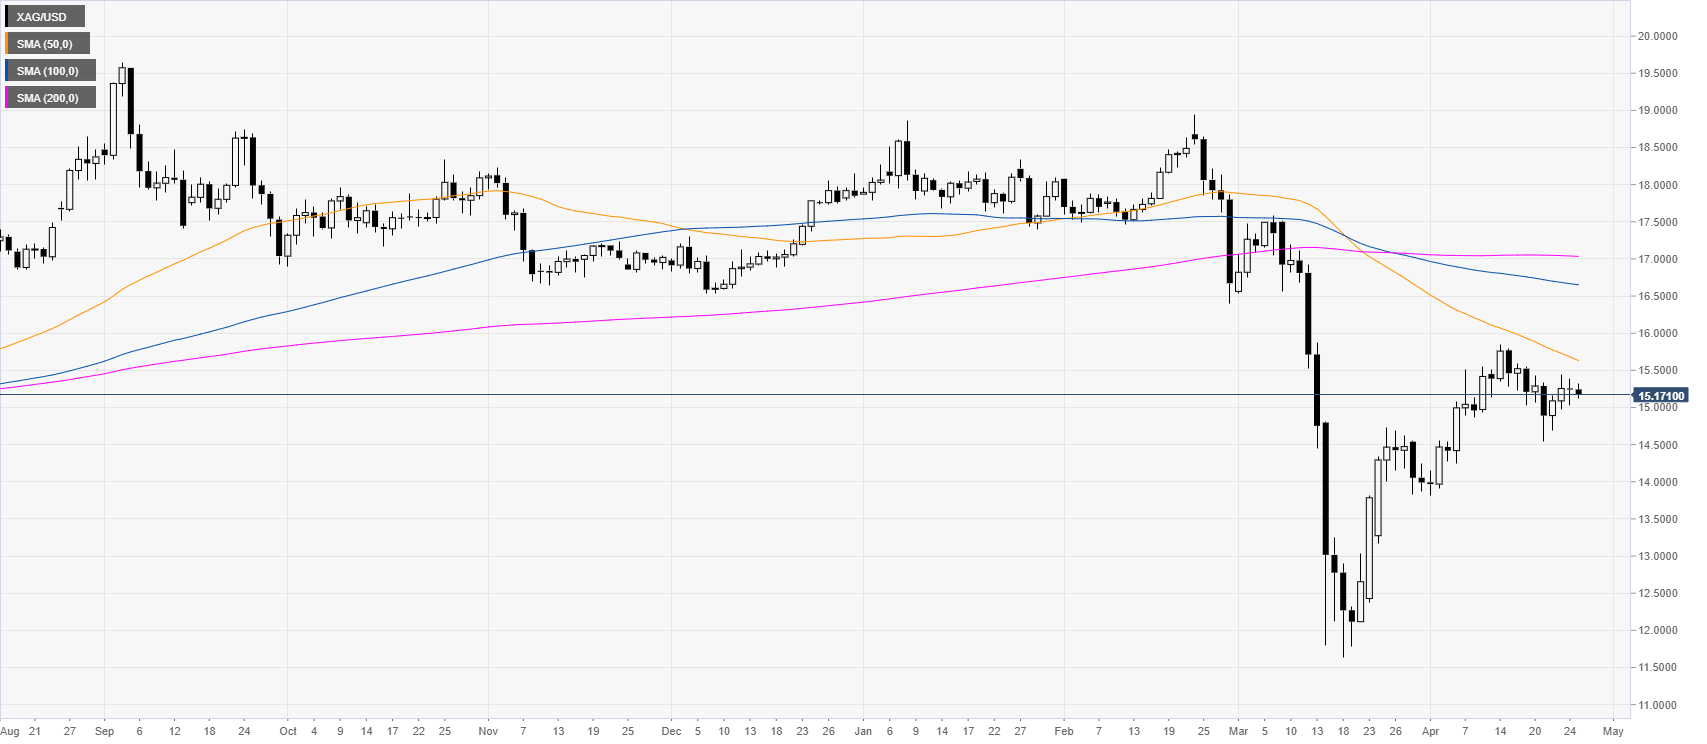
Silver daily chart
XAG/USD consolidates the sharp bullish correction from mid-March. However, silver remains below the main SMAs on the daily chart suggesting a negative bias in the long run but remains bullish in the medium-term.
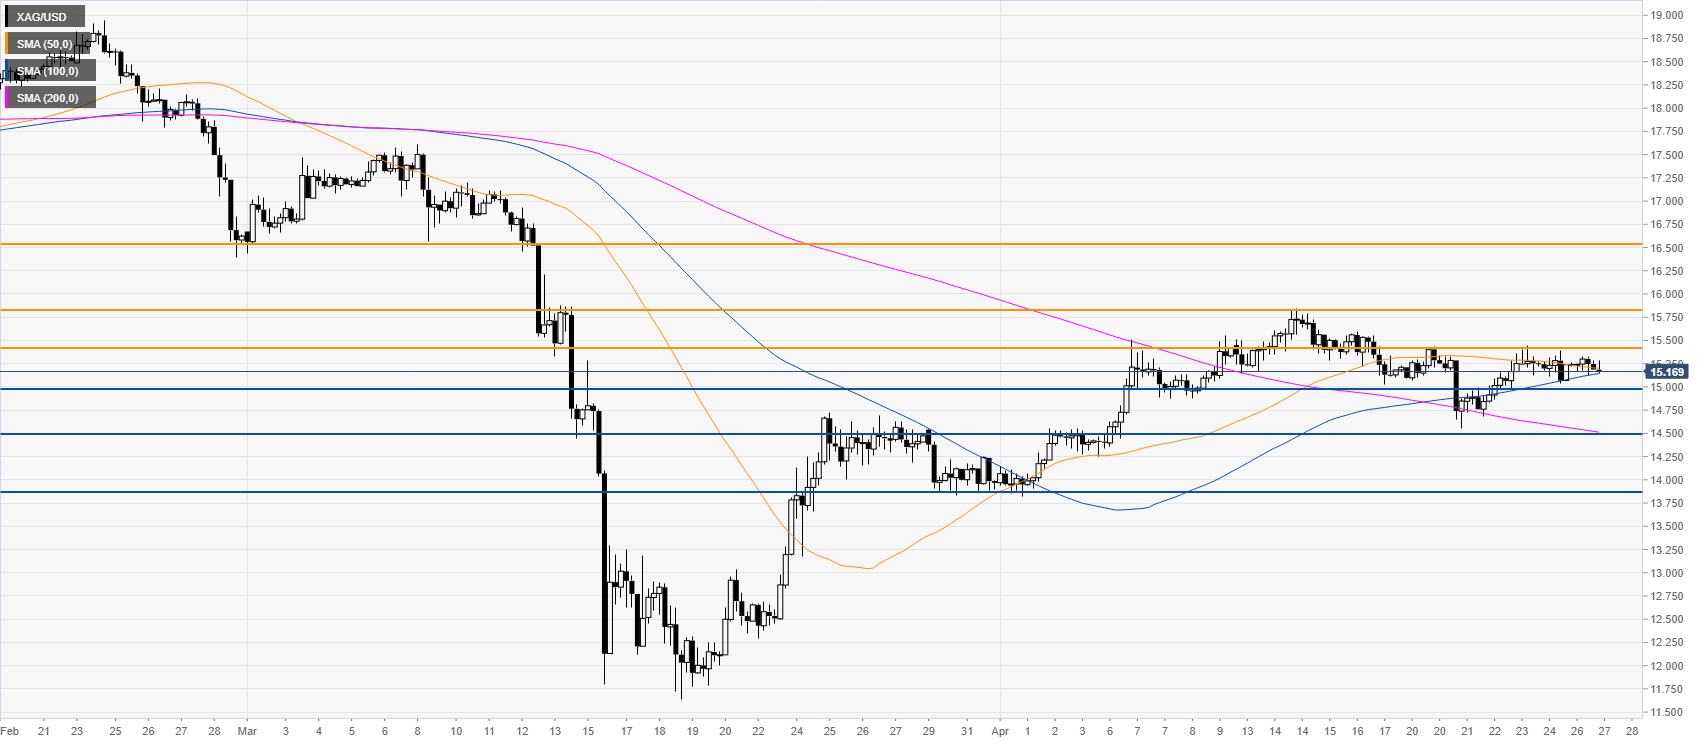
Silver four-hour chart
XAG/USD keeps consolidating below the 15.43 resistance near the 50 and 100 SMAs on the four-hour chart as the bulls are looking for a potential break above this above-mentioned level. A daily close above 15.43 should attract further speculative interest towards the 15.85 level (April high) and the 16.50 resistance. On the flip side, support should emerge near 15.00 and 14.50 levels.
Resistance: 15.43, 15.85, 16.50
Support: 15.00, 14.50, 13.90
Additional key levels