Back
10 Mar 2020
Silver Asia Price Forecast: Silver under pressure near $17.00/oz
- XAG/USD is under pressure below $18.00 per troy ounce.
- The level to beat for sellers is the 16.40 support.
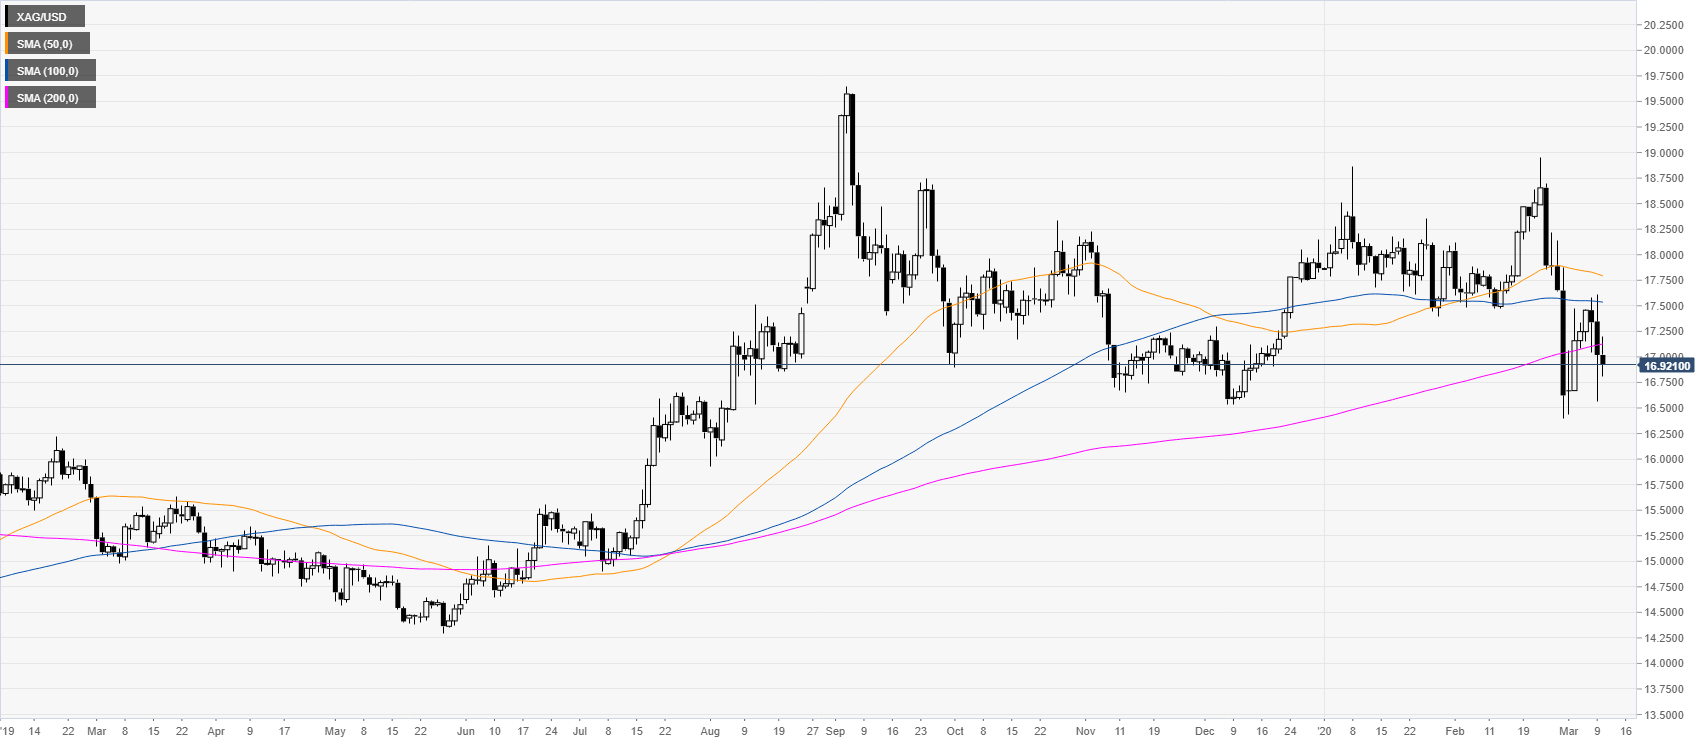
Silver daily chart
In the first two months of 2020, Silver has been consolidating the 2019 bull-run. The market is trading near the bottom of a rectangle pattern just below the main daily simple moving averages (SMAs). Silver is currently not reacting as much as gold to broad-based coronavirus fears.
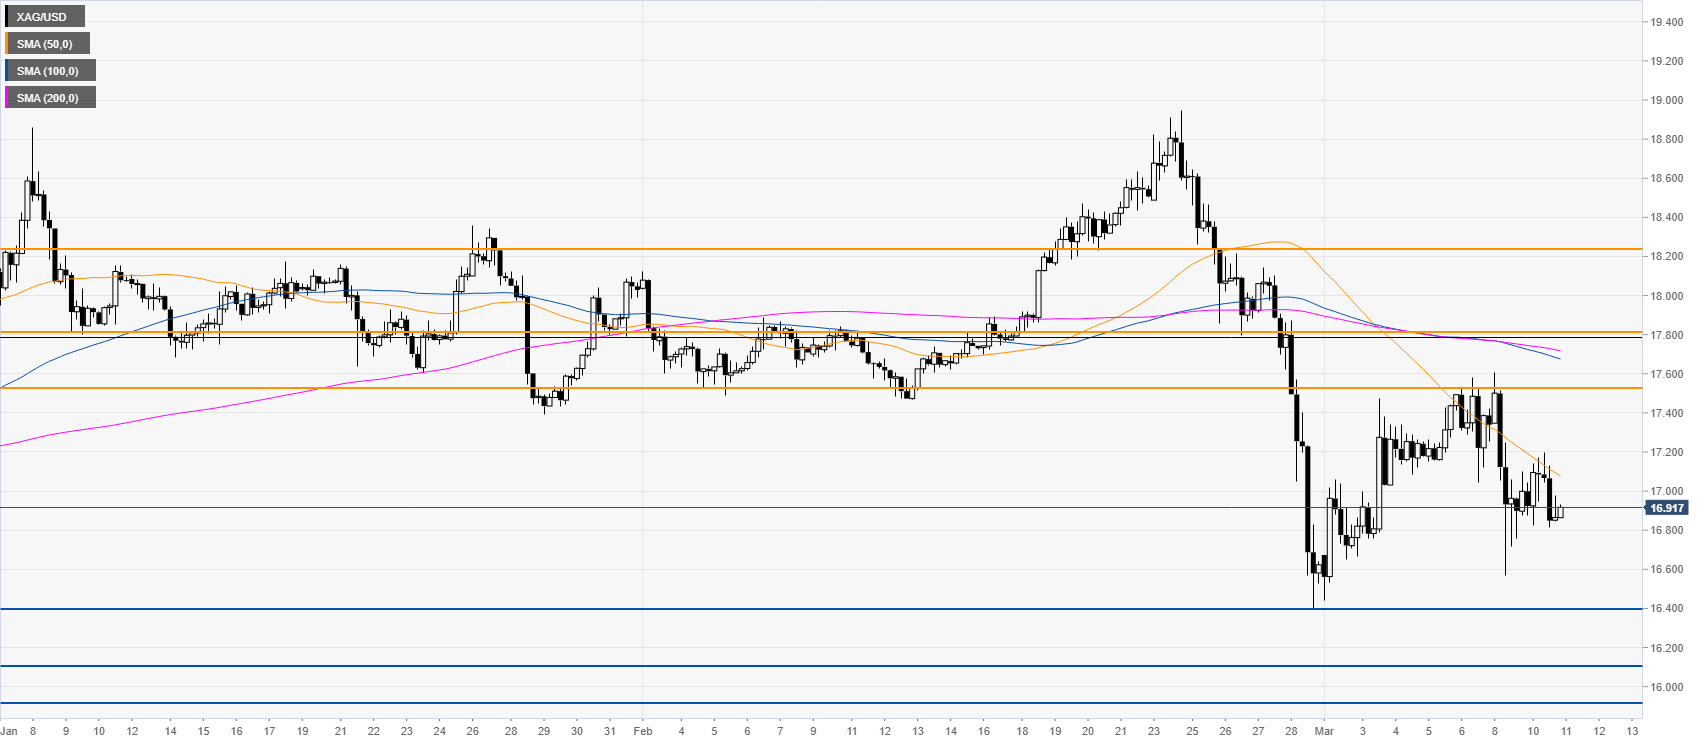
Silver four-hour chart
Silver is trading below its main SMAs as sellers want to break below the 2020 low near the 16.40 level. A break below the above-mentioned level can spark more losses towards the 16.10 and 15.90 price levels. Conversely, resistance is seen near the 17.52 level and a successful break above it could lead to further buying interest towards the 17.80 and 18.25 levels.
Resistance: 17.52, 17.80, 18.25
Support: 16.40, 16.10, 15.90
Additional key levels