GBP/JPY Price Analysis: Refreshes five-month low, near key horizontal support
- GBP/JPY drops to the lowest since early-October 2019, below 50% Fibonacci retracement of its August-October 2019 upside.
- Highs marked during late-July, September 2019 offer immediate support.
- 200-day SMA holds the key to pullback moves towards November 2019 bottom.
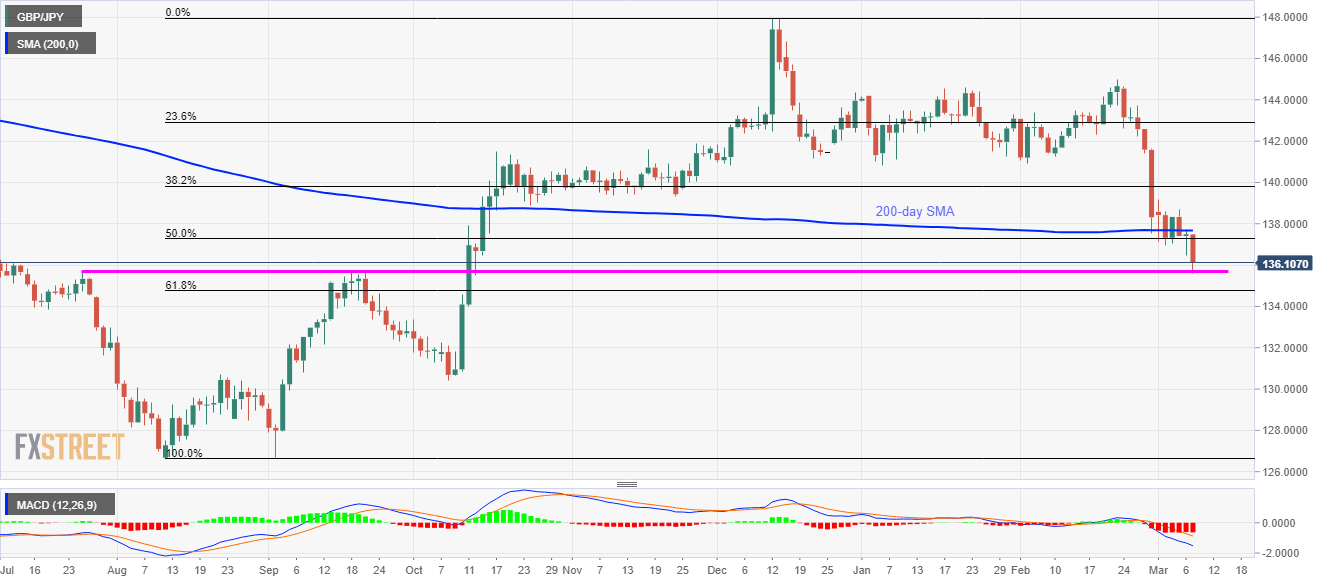
GBP/JPY registers 0.94% loss to 136.17 by the press time of Monday’s Asian session. The pair recently dropped to the lowest in five months after breaking 50% Fibonacci retracement support. However, highs marked during late-2019 seem to challenge the bears at the moment.
Although bearish MACD still favor the pair’s further selling, a daily closing below the 135.67/76 region becomes necessary for the bears to aim for 61.8% Fibonacci retracement level of 134.77.
During the pair’s further downside below 134.77, 133.30, 132.20 and October 2019 low near 130.40 can offer intermediate halts before highlighting 130.00 for the bears.
Meanwhile, the buyers will wait for the pair’s daily closing beyond a 200-day SMA level of 137.70 to target November 2019 low near 139.30 to be followed by 140.00 round-figure.
GBP/JPY daily chart
Trend: Pullback expected