Back
24 May 2019
USD/CHF technical analysis: Dollar down at its lowest level since mid-April nearing parity
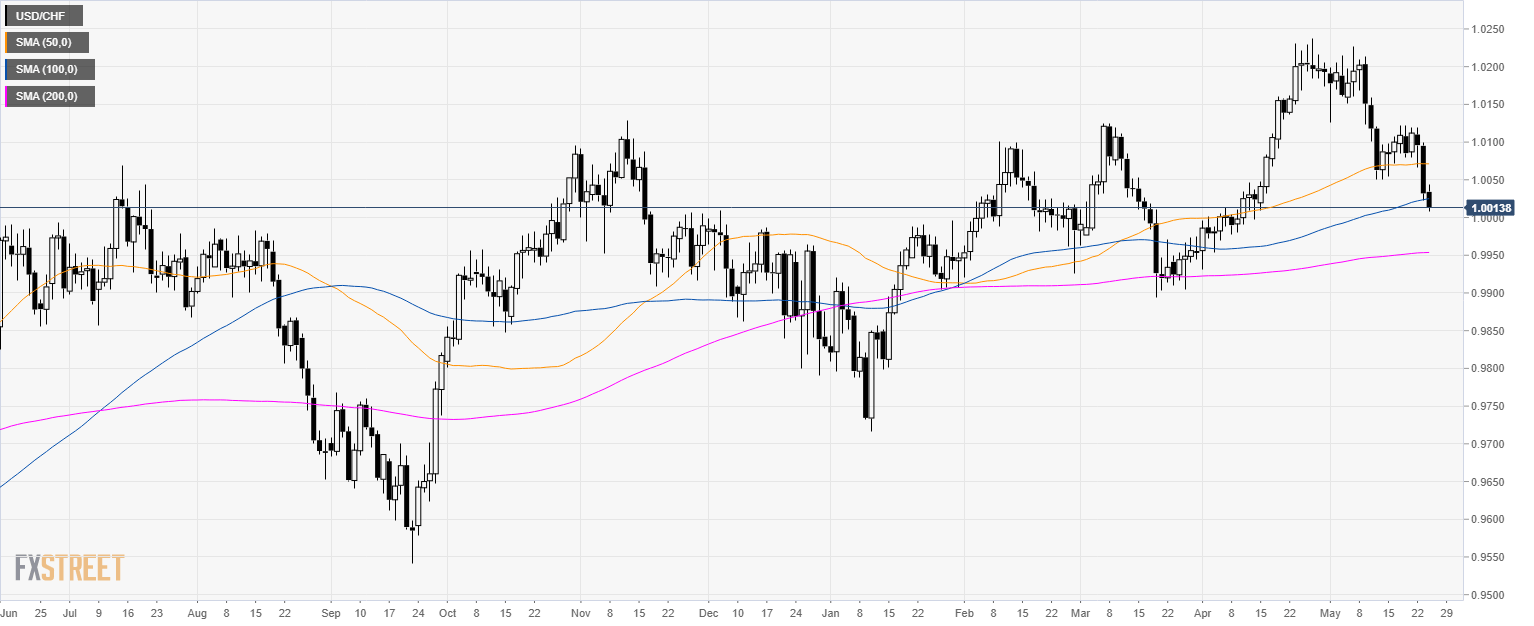
USD/CHF daily chart
USD/CHF is trading at its lowest since mid-April.
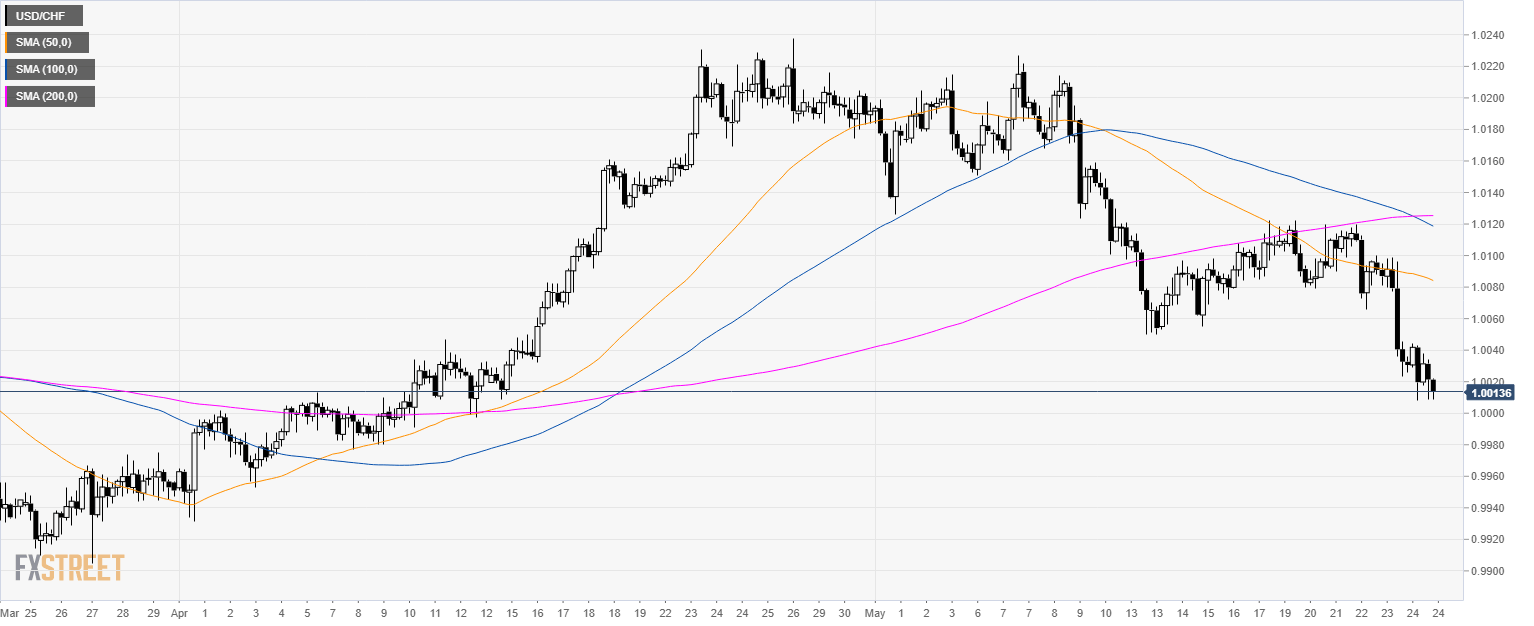
USD/CHF 4-hour chart
USD/CHF is very close to the parity level as the market trades below its main simple moving averages (SMAs).
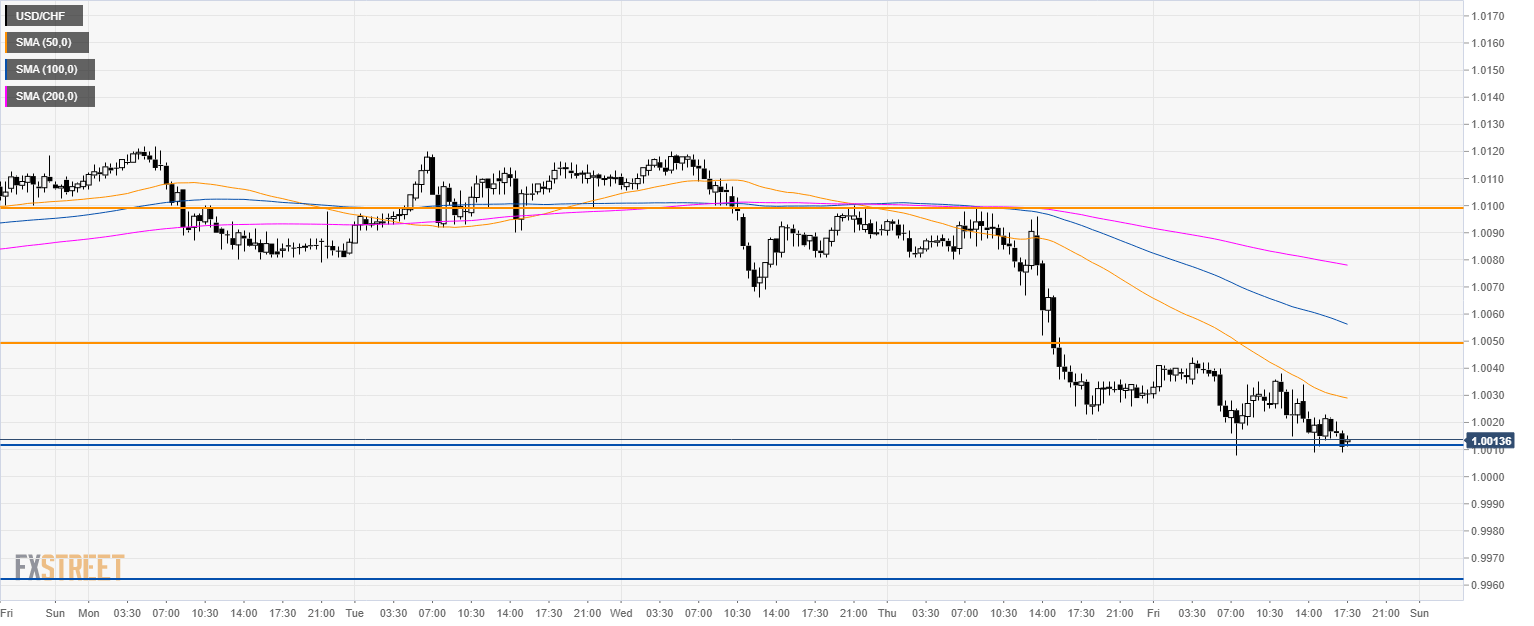
USD/CHF 30-minute chart
USD/CHF is trading below its main SMAs suggesting bearish momentum. A break below 1.010 can lead to 0.9960 support. Resistances are seen at 1.050 and 1.0100 levels.
Additional key levels