Back
28 Mar 2019
GBP/USD Technical Analysis: Cable dropping towards 1.3100 handle
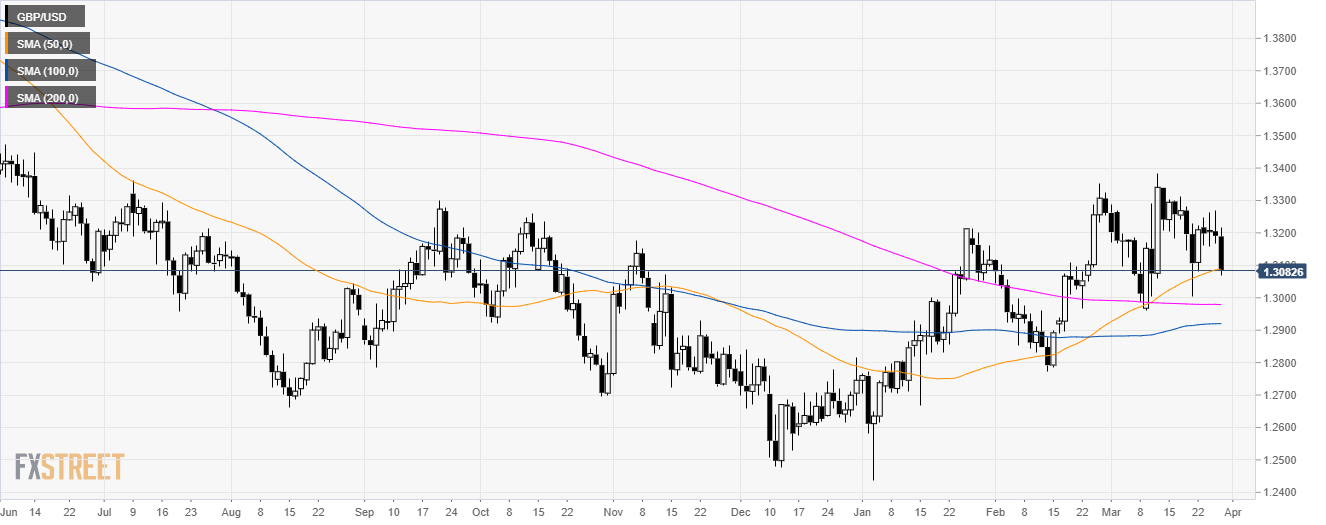
GBP/USD daily chart
- GBP/USD is trading is in consolidation mode above its 200-day simple moving average (SMAs).
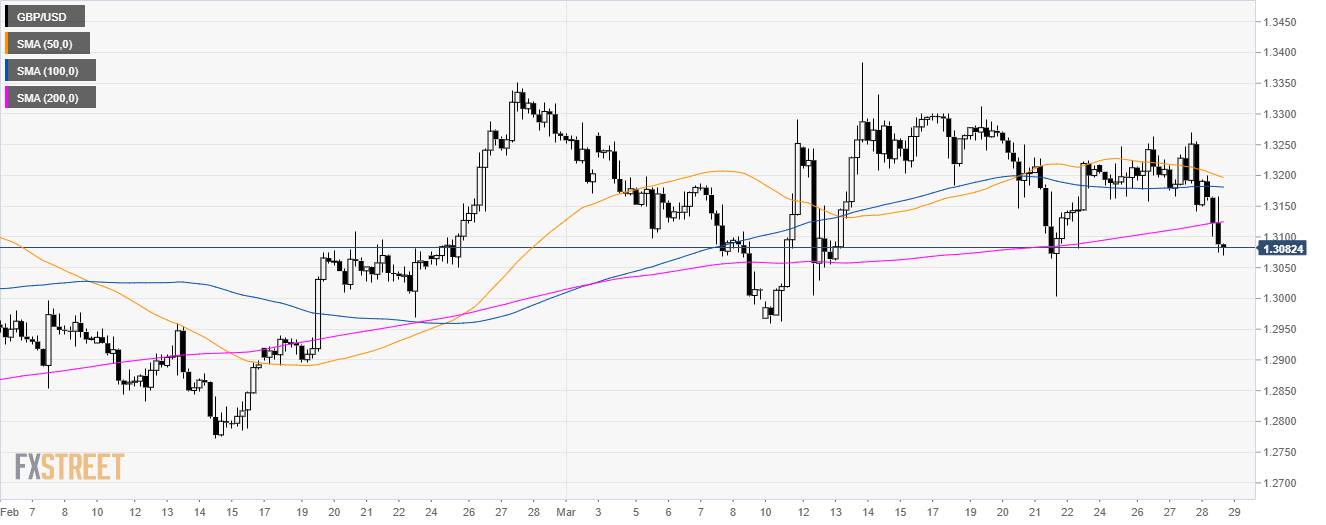
GBP/USD 4-hour chart
- GBP/USD is trading below its main SMAs suggesting a bearish momentum in the medium-term.
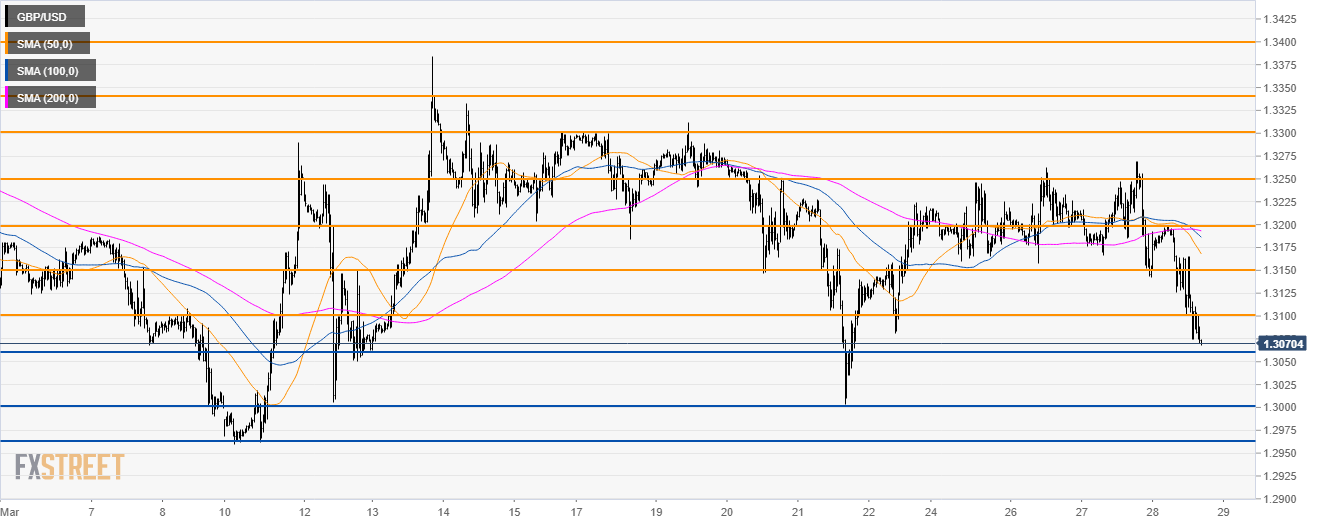
GBP/USD 30-minute chart
- A break below 1.3060 support should see Cable continuing weakening towards 1.3000 and 1.2960 level.
- Resistances are seen at 1.3100 and 1.3150 level.
Additional key levels