Back
1 Aug 2018
USD/CNY Technical Analysis: Drops below 6.80, bearish RSI divergence calls for a deeper pullback
- The USD/CNY pair fell below 6.80 and could suffer deeper losses, courtesy of the large bearish relative strength index (RSI) divergence seen in the daily chart.
- An uptick in the CNY could put a bid under the AUD, other China proxies, commodities.
Daily chart
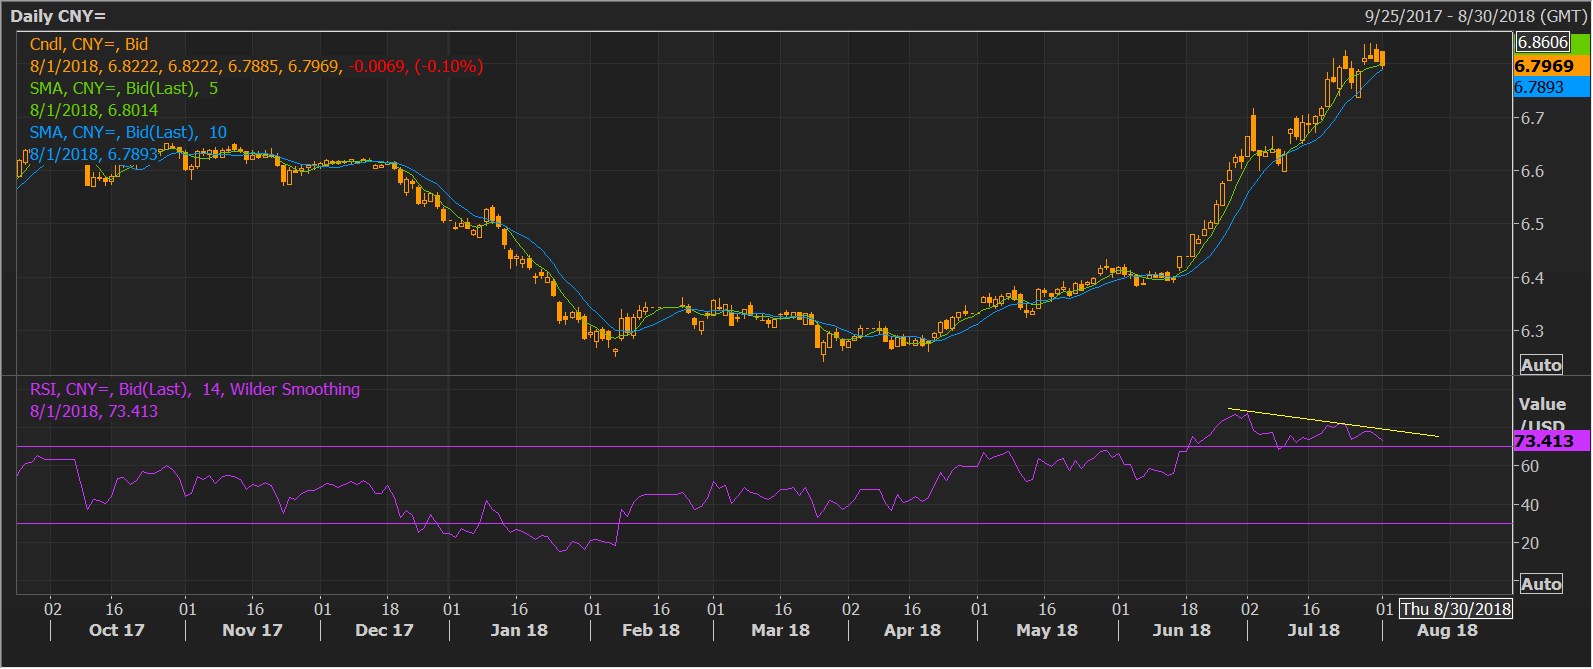
Spot Rate: 6.7935
Daily High: 6.8222
Daily Low: 6.7885
Trend: Bearish
Resistance
R1: 6.8222 (daily high)
R2: 6.8389 (July 30 high)
R3: 6.8440 (July 2017 high)
Support
S1: 6.7891 (10-day moving average)
S2: 6.7360 (July 26 low)
S3: 6.7168 (July 3 high)