NZD/USD Price Analysis: Drops to 0.5630, extending its bearish streak
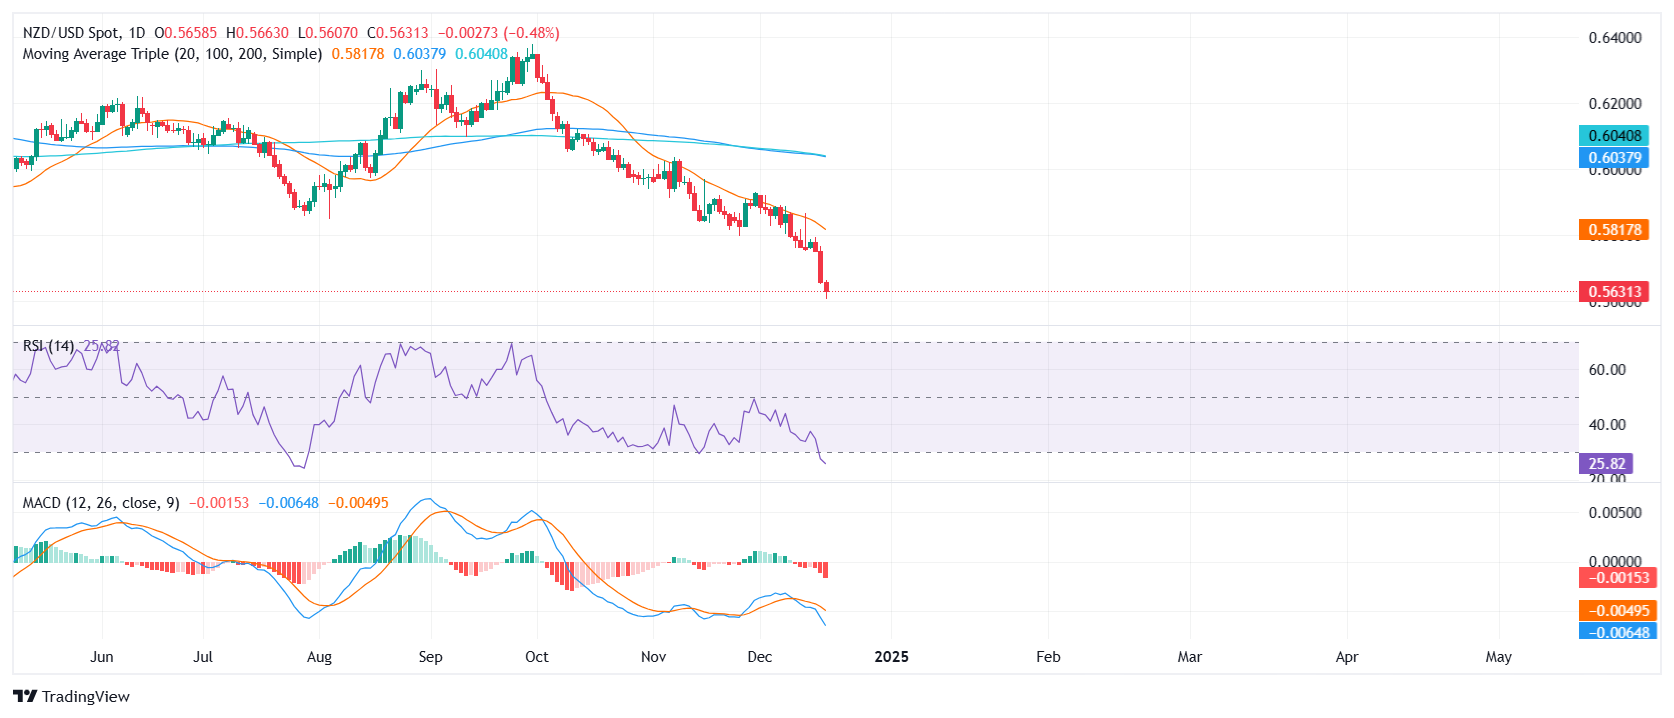
- NZD/USD falls on Thursday, settling near 0.5630 and hitting new multi-year lows.
- Pair remains well below the 20-day SMA, reinforcing the entrenched bearish trend at its lowest levels since October 2022.
- RSI stands at 26 in oversold territory, offering little hope of a reversal, while MACD histogram shows rising red bars, indicating persistent selling pressure.
The NZD/USD pair extended its downtrend on Thursday, slipping by 0.36% to approximately 0.5630, a fresh multi-year low. Efforts by the bulls to stage any meaningful recovery continue to falter, as the 20-day Simple Moving Average (SMA), hovering around 0.5890, remains a distant target and a key barrier to halting the decline.
Technical indicators underscore the dire state of affairs. The Relative Strength Index (RSI) at 26 confirms oversold conditions, yet its inability to rebound suggests persistent downward momentum. Meanwhile, the Moving Average Convergence Divergence (MACD) histogram prints rising red bars, further cementing the bearish outlook and reducing the likelihood of a near-term turnaround.
As long as NZD/USD lingers below the 20-day SMA, the overall bias remains clearly negative. With no clear support levels nearby, the pair could face additional downside risks, keeping sellers firmly in control of the market’s direction.

