Silver Price Analysis: XAG/SUD consolidates in a range around $25.00, below multi-month peak
- Silver oscillates in a range for the second successive day on Thursday.
- A slightly overbought RSI is holding back bulls from placing fresh bets.
- The technical setup supports prospects for a further appreciating move.
Silver (XAG/USD) continues with its struggle to find acceptance above the $25.00 psychological mark and seesaws between tepid gains/minor losses for the second successive day on Thursday. The white metal extends its sideways consolidative price move through the first half of the European session as traders look forward to the US PCE Price Index for some meaningful impetus.
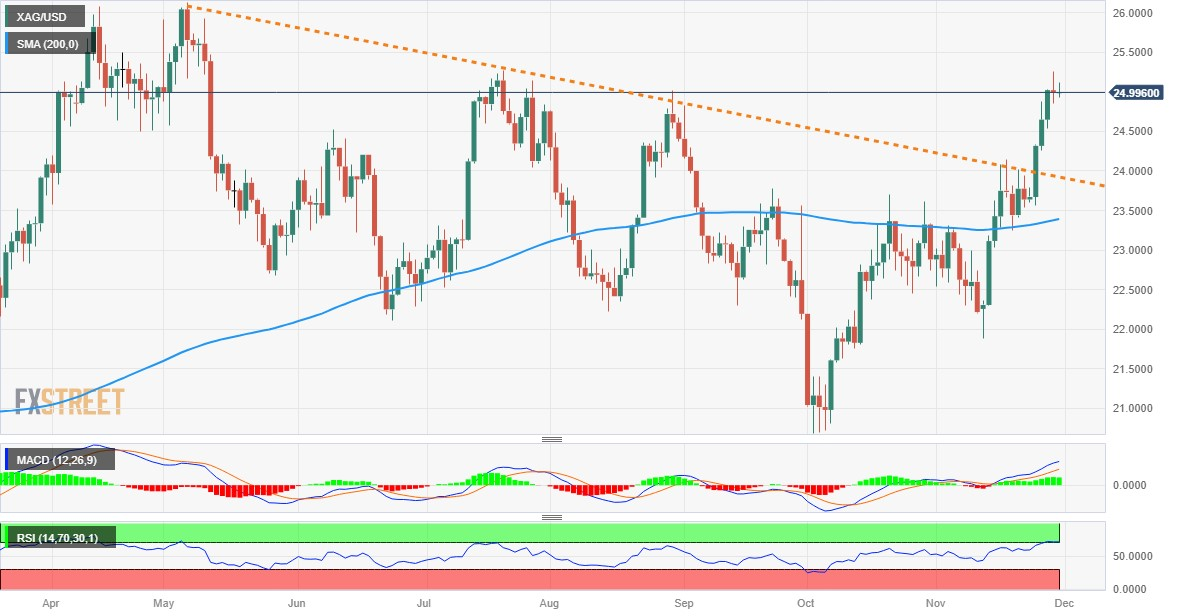
From a technical perspective, the Relative Strength Index (RSI) on the daily chart is flashing slightly overbought conditions and holding back bulls from placing fresh bets. That said, the recent sustained move beyond the very important 200-day Simple Moving Average (SMA) and a subsequent breakout through a multi-month-old descending trend-line suggests that the path of least resistance for the XAG/USD is to the upside. However, it will still be prudent to wait for some near-term consolidation or a modest pullback before positioning for an extension of a well-established uptrend witnessed over the past three weeks or so.
In the meantime, the $24.75-$24.70 region is likely to protect the immediate downside. Any further corrective slide is likely to attract fresh buyers near the $24.20-$24.15 zone. This should help limit the downside for the XAG/USD near the aforementioned descending trend-line resistance breakpoint, around the $24.00 mark. The latter should act as a key pivotal point, which if broken decisively might prompt some technical selling and pave the way for deeper losses, towards retesting the 200-day SMA, near the $23.40-$23.35 area.
On the flip side, the $25.25 region, or over a four-month high touched on Wednesday, could offer some resistance. Some follow-through buying will be seen as a fresh trigger for bullish traders and lift the XAG/USD towards the next relevant hurdle near the $25.55-$25.60 zone. The momentum could get extended further and allow the white metal to reclaim the $26.00 mark and test the YTD peak, around the $26.15 region touched in May.
Silver daily chart

Technical levels to watch
