NZD/USD Price Analysis: Forms a bullish engulfing candle pattern, higher grounds expected
- NZD/USD continues an uptrend, gaining 0.56% from Wednesday’s session, trading above the 0.6200 mark.
- An upward bias shift is expected if the pair rises above the 200-day EMA at 0.6230 and breaks last week’s high of 0.6247.
- NZD/USD could aim for the May 23 high of 0.6302 and potentially the May 11 high at 0.6384, with strong support at the 100-day EMA (0.6196).
As the Asian session begins, the NXD/USD resumes its uptrend as the pair finished Wednesday’s session with solid gains of 0.56%. In addition, it formed a two-candlestick bullish engulfing chart pattern, suggesting further upside is expected. The NZD/USD exchanges hands above the 0.6200 figure, gains around 0.07%.
NZD/USD Price Analysis: Technical outlook
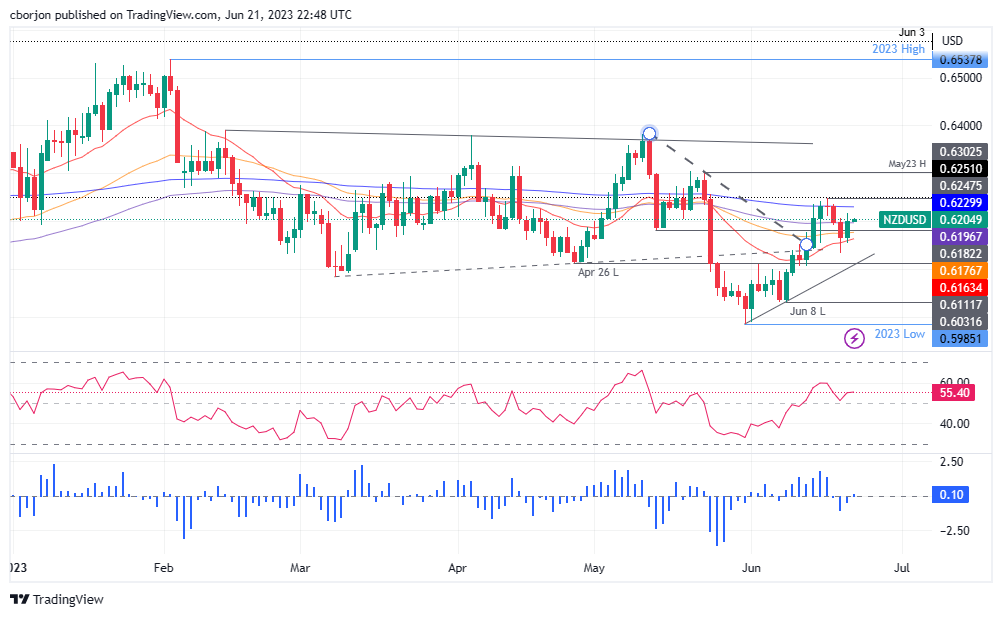
The NZD/USD daily chart portrays the pair trading sideways, trapped between short-term and long-term daily Exponential Moving Averages (EMAs). Even though the Kiwi (NZD) registered gains, unless it climbs above the 200-day EMA at 0.6230 and cracks the last week’s high of 0.6247, it would shift the pair bias upwards.
If NZD/USD clears those areas, the next resistance would be the May 23 high at 0.6302. Buyers are reclaiming that level, and the pair could rally towards the May 11 swing high at 0.6384 before reaching 0.6400. Conversely, the NZD/USD first support would be the 100-day EMA at 0.6196. Once broken, the next floor will be the 50-day EMA at 0.6176, closely followed by the 20-day EMA at 0.6163 and then the 0.6100 mark.
From an oscillator point of view, the Relative Strength Index (RSI), albeit in bullish territory, is almost flat, while the three-day Rate of Change (RoC) suggests the pair is pausing its downtrend.
NZD/USD Price Action – Daily chart